
With the election on the horizon, support for Trump mirrors Brexit betting trends.
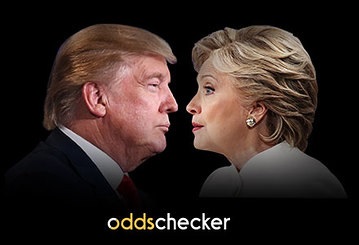
It seems like a lifetime ago that betting markets opened for the next president of the United States of America but with less than two weeks until the vote we are very close to finding out the outcome. That market started with all of the Republican and Democrat nominee candidates back in November 2014 and is now down to the two nominees, Donald Trump and Hillary Clinton.
What’s fascinating is that there is a clear relationship between the betting trends of the upcoming US election and that of Brexit earlier in the year. Over the past two years, 61% of bets placed on the two candidates have backed Trump. However, only 40% of the combined stakes are on Trump. When Brexit happened back in June bettor behaviour was very similar. 73% of bets placed backed Leave, whilst just 42% of the stakes were on Leave. Is this a sign of things to come?
Brexit v US Election
| Remain/Clinton (stakes) | Leave/Trump (stakes) | Remain/Clinton (bets) | Leave/Trump (bets) | |
|---|---|---|---|---|
| Brexit | 58% | 42% | 27% | 73% |
| US Elections | 60% | 40% | 39% | 61% |
Democratic Primaries
Hillary Clinton won the 2016 Democratic Party Presidential Primaries, beating Bernie Sanders to the nomination in a campaign that ran from February until June. The result was relatively one-sided, with Clinton picking up 34 out of 57 contests and 55.2% of the vote.
| Hillary Clinton | Bernie Sanders | |
|---|---|---|
| Delegate count | 2,842 | 1,865 |
| Contests won | 34 | 23 |
| Popular vote | 16,914,722 | 13,206,428 |
| Percentage | 55.2% | 43.1% |
Republican Primaries
Donald Trump had a bit more competition with the 2016 Republican Presidential Primaries, with Marco Rubio and John Kasich, as well as Ted Cruz in the running until the latter stages. Nevertheless, Trump's victory over Cruz was relatively convincing, picking up 41 contests to Cruz's 11 and 44.9% of the vote.
| Donald Trump | Ted Cruz | |
|---|---|---|
| Delegate count | 1,441 | 551 |
| Contests won | 41 | 11 |
| Popular vote | 14,015,993 | 7,822,100 |
| Percentage | 44.9% | 25.1% |
The implied probabilities of becoming president for Trump and Clinton has differed considerably for the two candidates over time, with Clinton more sure of the Democratic nomination from the start than Trump was with the Republican one. We've had a look at the trends of implied probability in the graph below:
Implied Probability of becoming President

Back in November 2014, Clinton had a good chance of being elected, as the favourite for the Democrat nomination, and started with a 42.1% chance of being elected as President (or odds of 11/8). Trump, on the other hand, seemingly had no hope pf making it into the White House, with a 1% chance (or odds of 100/1).
Both candidates trended at similar implied probabilities until the latter months of 2015. For the democrats, it became clear that Bernie Sanders' strong grassroots campaign and strong social media following was not necessarily going to translate into the polls and ultimately, votes. Subsequently, Clinton's implied probability jumped from 40% to 55.6% from October to November 2015.
At a similar time, support was growing amongst Republicans for Donald Trump. Once it became clear that he was a serious contender to win the nomination, his implied probability of being elected grew steadily from late 2015 into the primaries in 2016.
Once the primaries were won for both Clinton and Trump, the bookies gave Clinton a 63.70% chance and Trump a 25% chance of being elected, or 4/7 and 3/1 respectively. That is where Trump's implied probability of being elected peaked, in the summer months of 2016. Clinton called half of Trump's supporters deplorables, calling them racist and homophobic, just a week before doubts over her health started to emerge. Some bookies were even offering odds lower than 2/1 on Trump.
The debates have not gone in Trump's favour though, and that coupled with sexist videos containing Trump making it into the public eye, meant huge investments in CLinton and Trump's odds drifting quite dramatically. His longest odds in October have been 5/1, meaning an implied probability of 16.7%, with Clinton at 2/5 with an implied probability of 71.4%.
Betting patterns by month
| Hillary Clinton | Donald Trump | |
|---|---|---|
| October 2015 | 27.8% | 11.1% |
| November 2015 | 16.7% | 5.6% |
| December 2015 | 16.7% | 10.4% |
| January 2016 | 14.3% | 22.9% |
| February 2016 | 26.1% | 12.4% |
| March 2016 | 8% | 14.2% |
| April 2016 | 6.7% | 14.7% |
| May 2016 | 6.9% | 47.1% |
| June 2016 | 14.6% | 60.4% |
| July 2016 | 25% | 48.9% |
| August 2016 | 22.4% | 38.8% |
| September 2016 | 31.4% | 34.8% |
| October 2016 | 31.7% | 47.6% |
As betting odds are set based on liabilities, as opposed to probability, the betting data trends on Oddschecker haven't really followed the pattern of the implied probabilities. In general throughout the election campaign, there has been more money staked on Clinton but a higher volume of bets on Trump.
Betting activity on this market started to pick up significantly in October 2015. Clinton had the higher percentage of early bets because Trump was in no way assured of winning the Republican nomination and that trend continued until early 2016.
From the end of the primaries, the pattern of the larger bets staked on Clinton and a high volume of smaller bets staked on Trump has, by and large, continued until the end of October. The only exception to that was in August and early September, when there were questions over Hillary's health. Bernie Sanders saw a renaissance in betting activity because of that, causing a fall in confidence in Hillary Clinton.
While Trump's odds have been drifting over the last few weeks, there seems to be no shortage of users willing to back him, even at 5/1, as he still commands 47.6% of total bets. The same can not be said of Hillary, with the highest amount of bets placed on her throughout whole campaign at 31.7%.